How Charles Booth mapped London poverty
Charles Booth’s Inquiry into the Life and Labour of the People in London revealed the complexity of social class in the late 19th-century capital.
1886–1903
A street-level investigation into social class
London has long been a place where wealth and poverty exist side by side. Many areas have undergone rapid development – or gentrification – over the past 100 years. But difficulty and hardship have never left.
In the 1880s, motivated by the scale of the city’s poverty, social reformer Charles Booth conducted surveys into working class life. As a part of this inquiry, he produced maps that coloured residential streets according to the wealth of their inhabitants. These maps illustrated seven different social classes existing in the capital. They also proved that the problem of poverty was worse than first thought.
London’s poverty problem
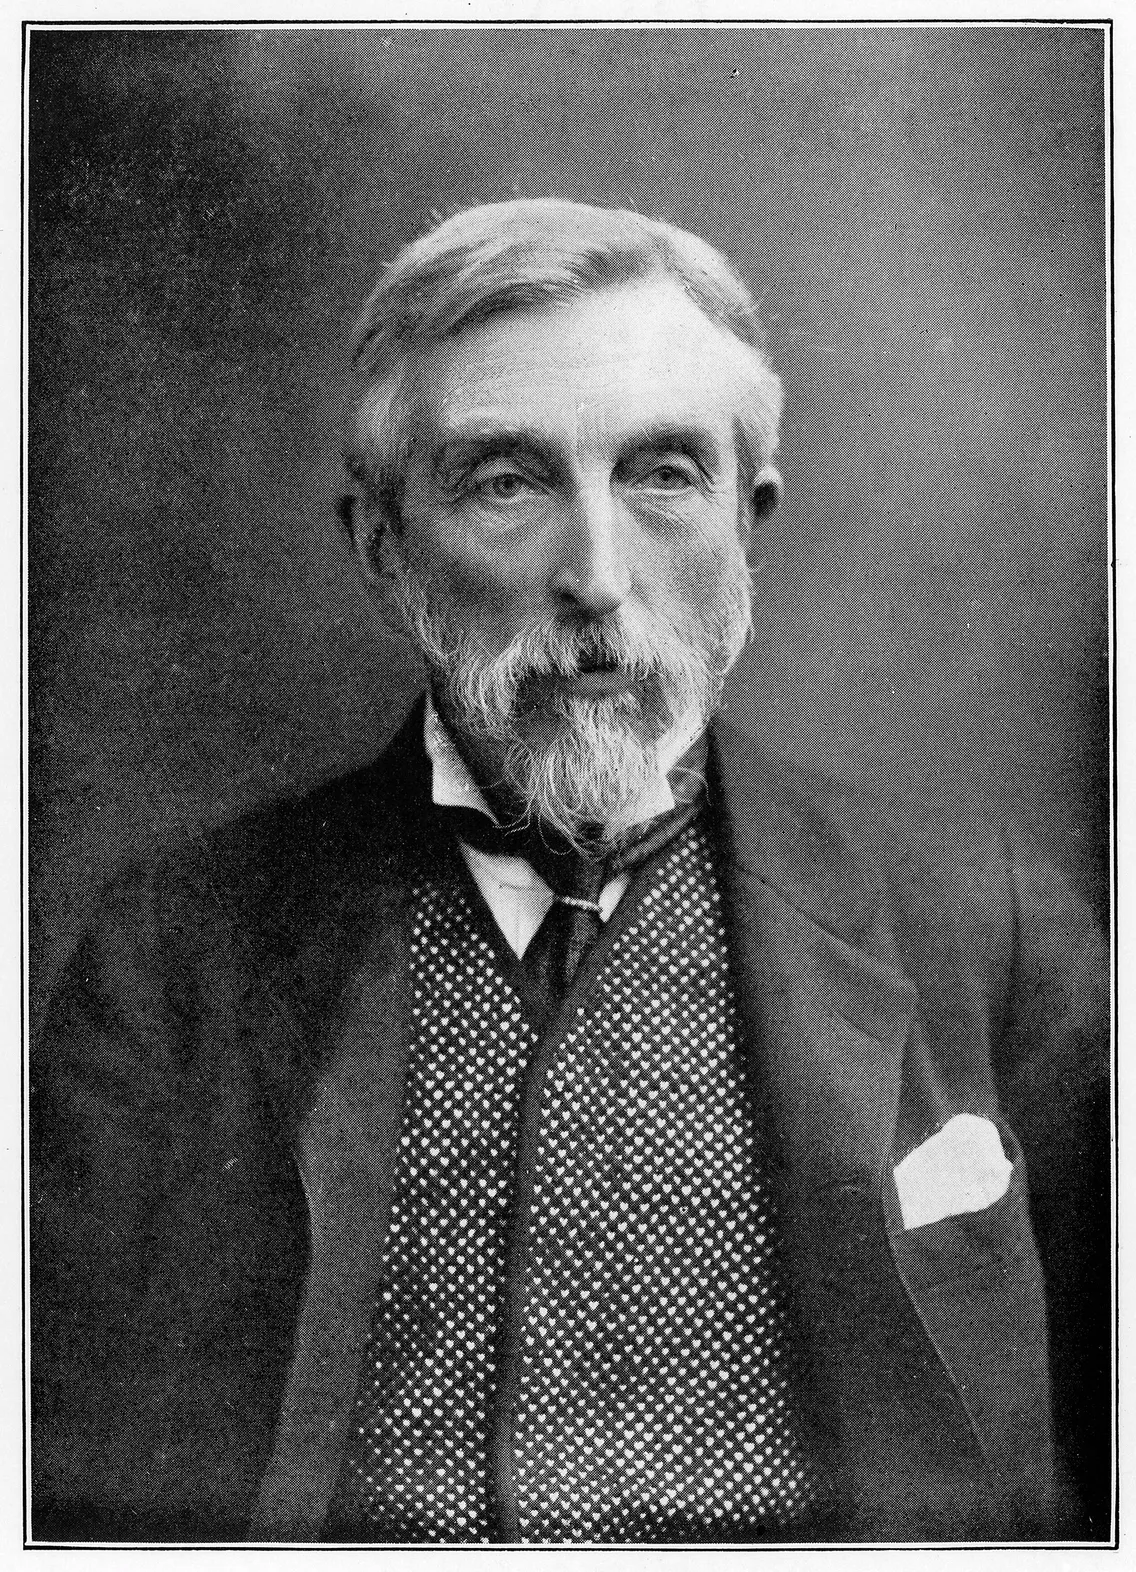
Born in Liverpool in 1840, Charles Booth was a successful businessman who, after moving to London, became committed to researching poverty and living conditions.
He questioned an 1885 Social Democratic Federation inquiry that said up to 25% of the population of London lived in extreme poverty. This was, Booth thought, “grossly overstated”. He would carry out his own inquiry instead.
Between 1886 and 1903, Booth both funded and led a team of investigators to gather information about poverty, industry and religious influences in London. Booth’s poverty maps were the most compelling outcome of this Inquiry into the Life and Labour of the People in London.
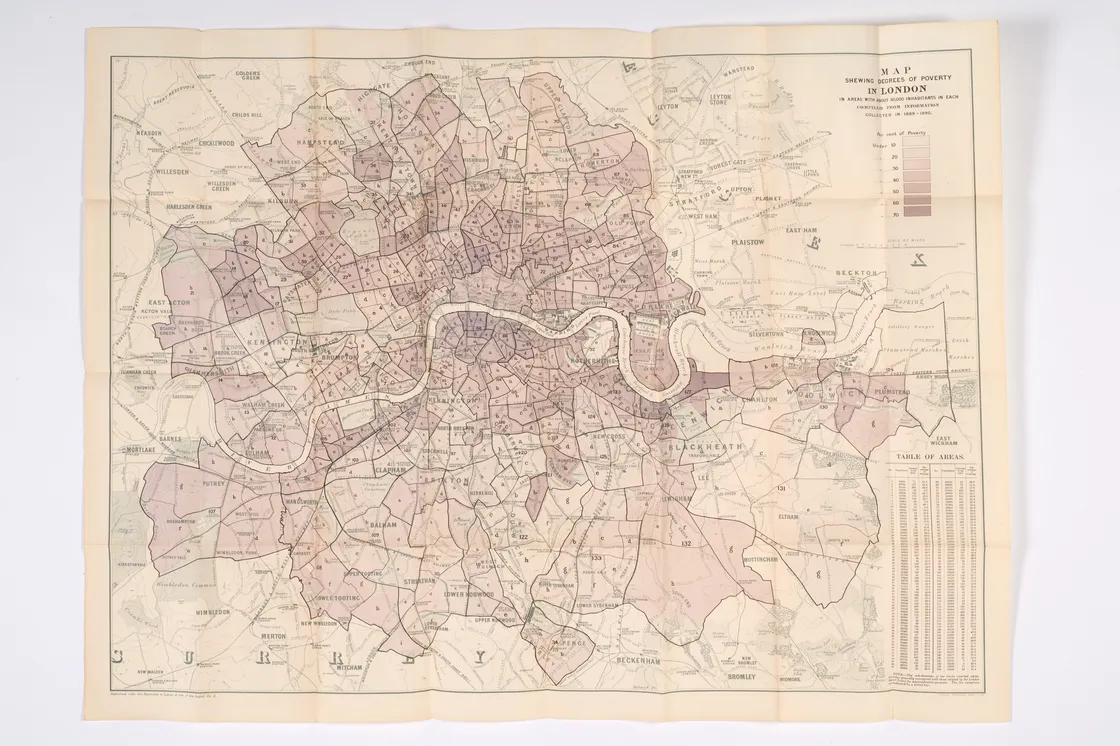
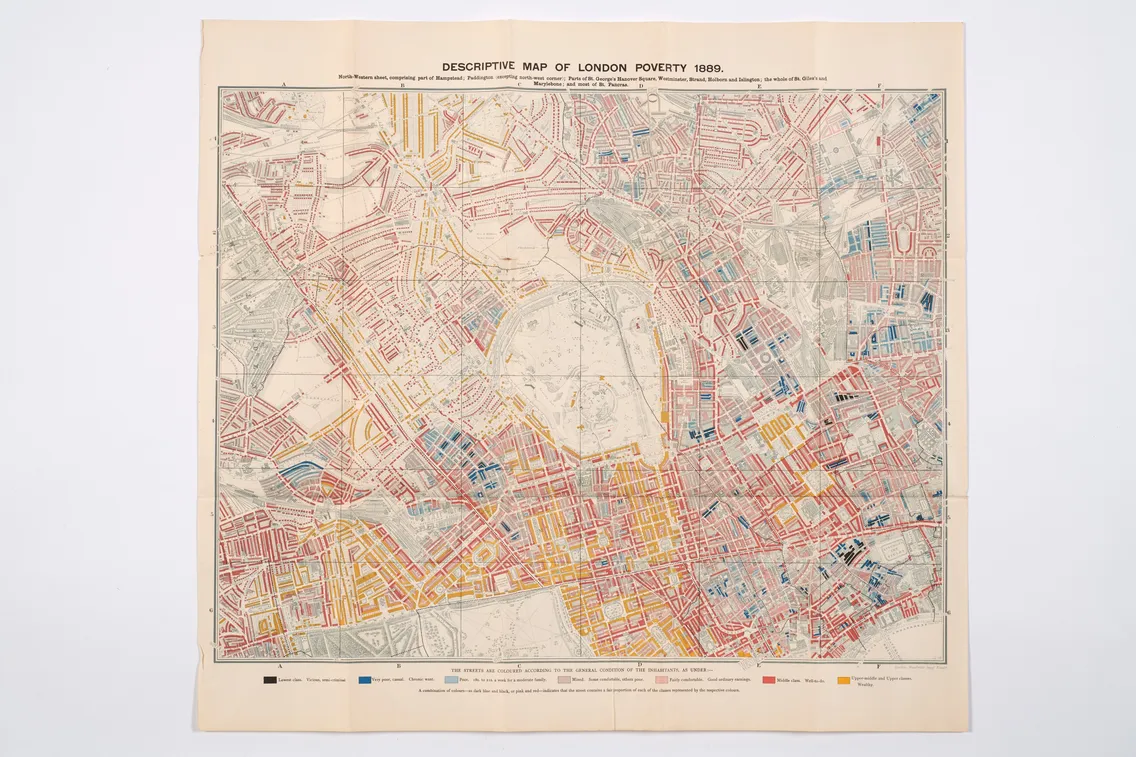
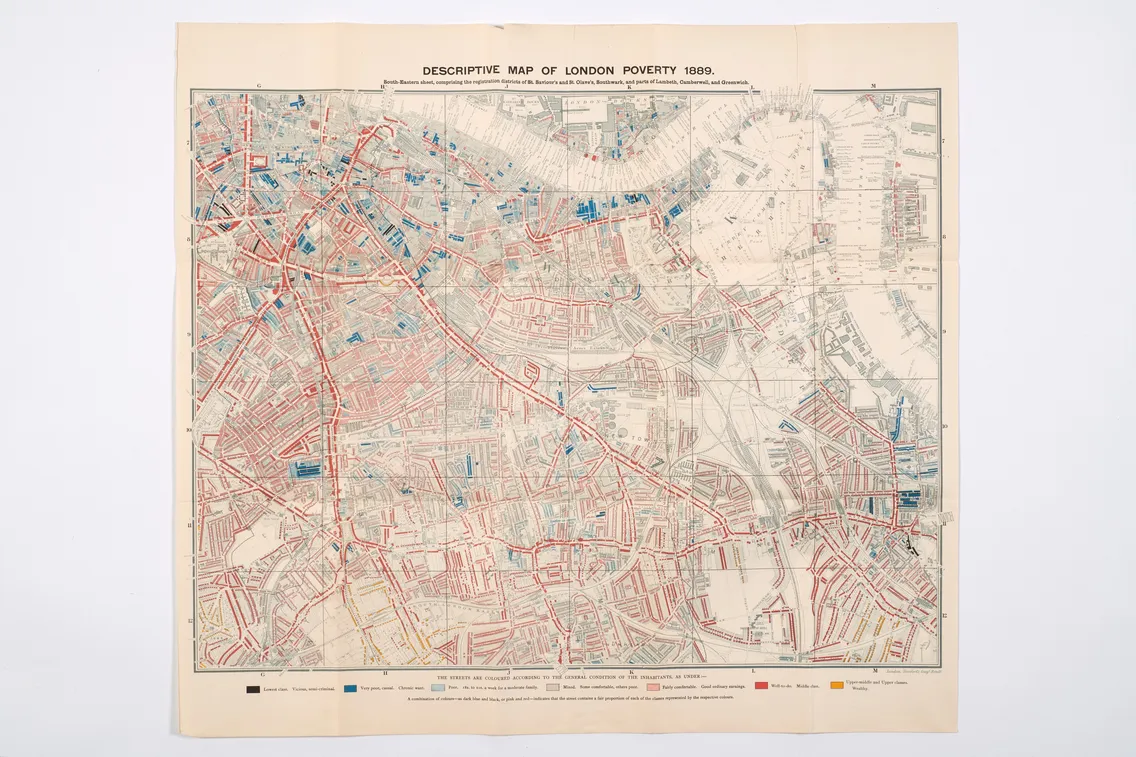
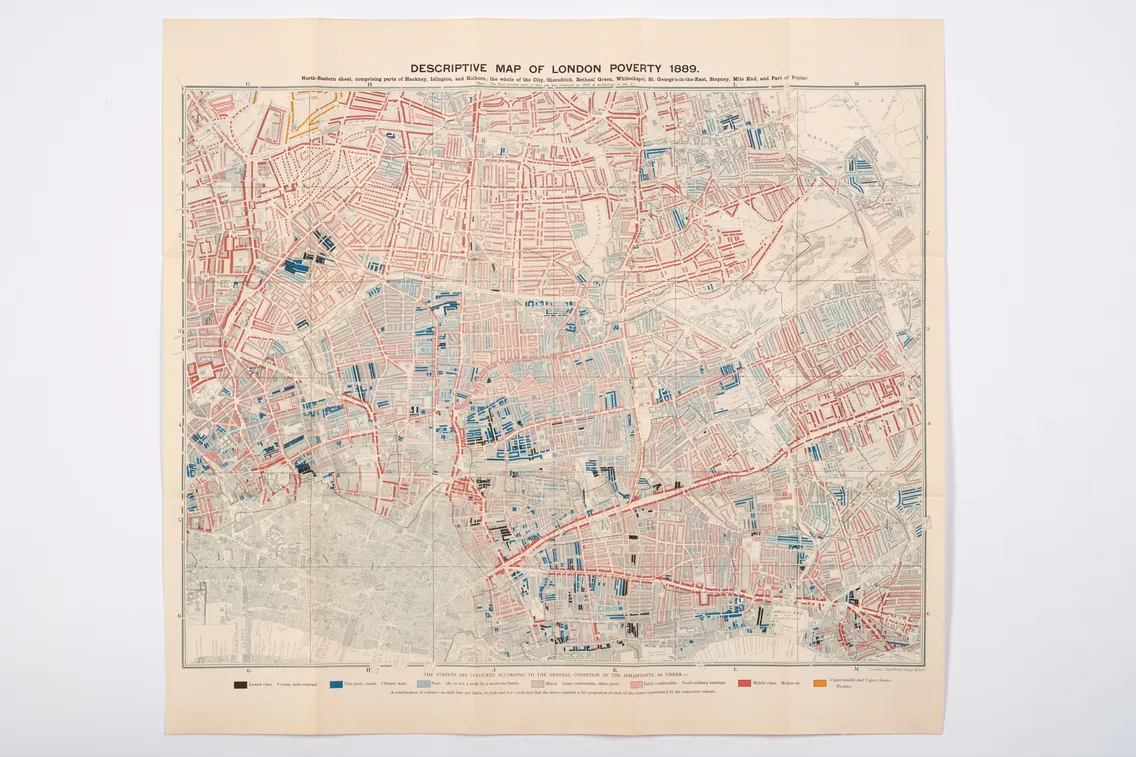
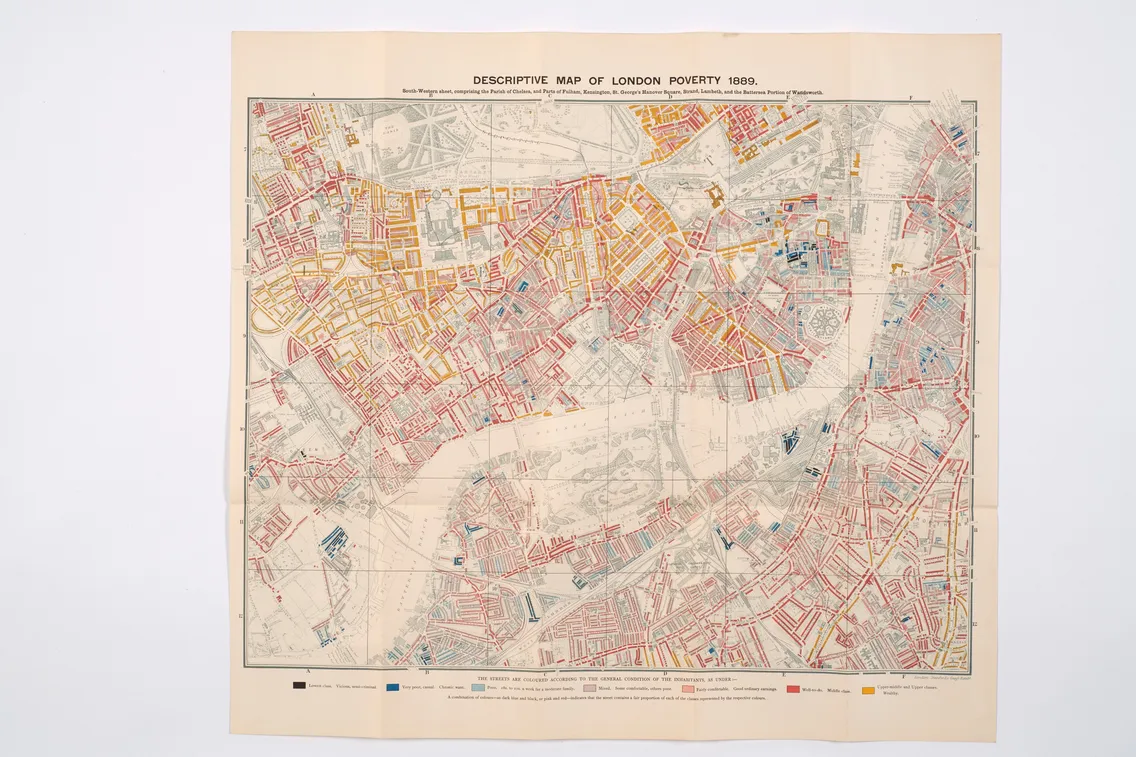
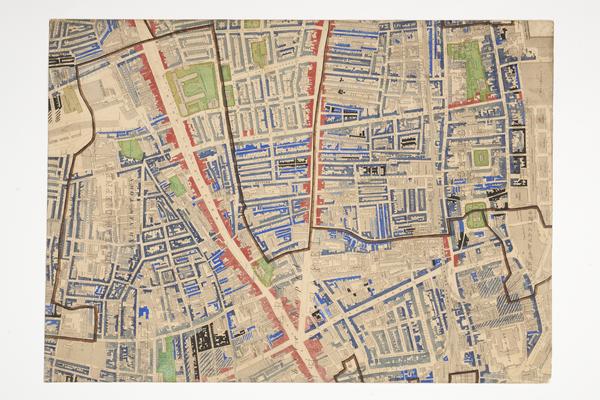
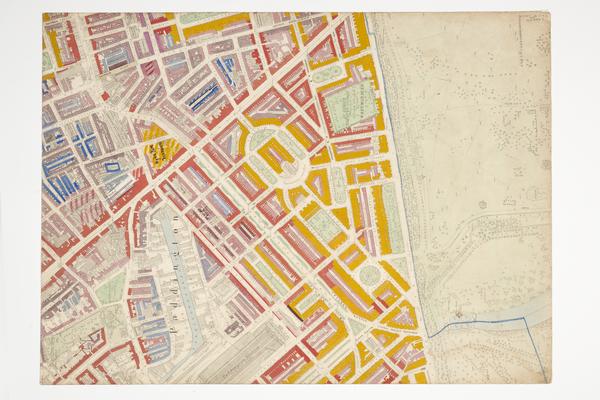
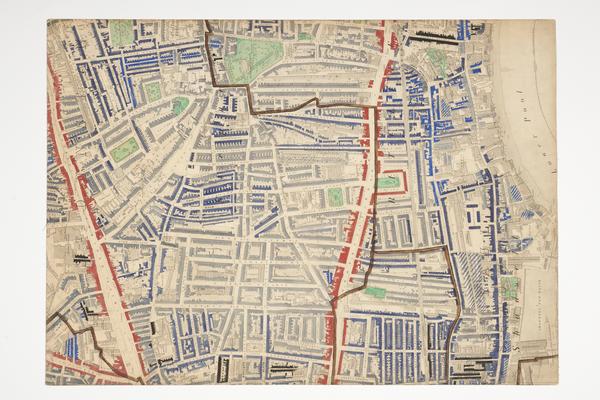
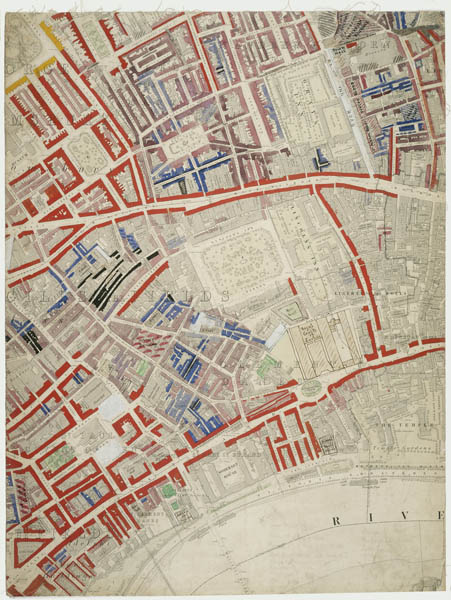
Booth's map illustrates the degrees of poverty across London.
Creating the poverty maps
Booth’s assistants produced the map as part of his first Inquiry. The first edition of the map was published in 1889 and covered east London. It was based on information gathered by the School Board Visitors, cross-referenced against reports by charities and social workers.
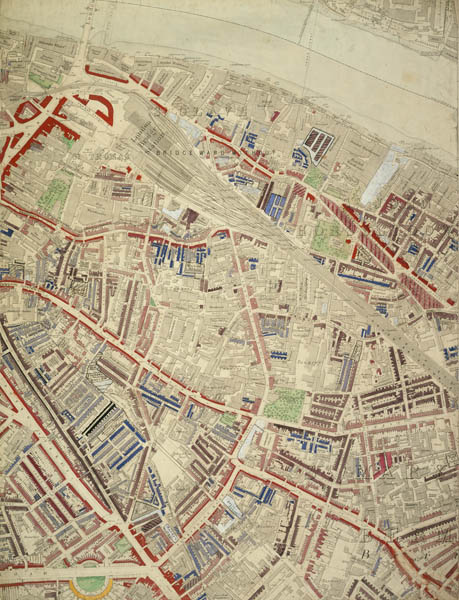
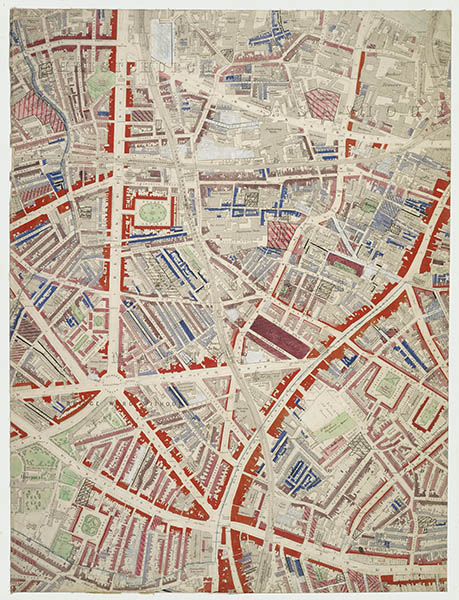
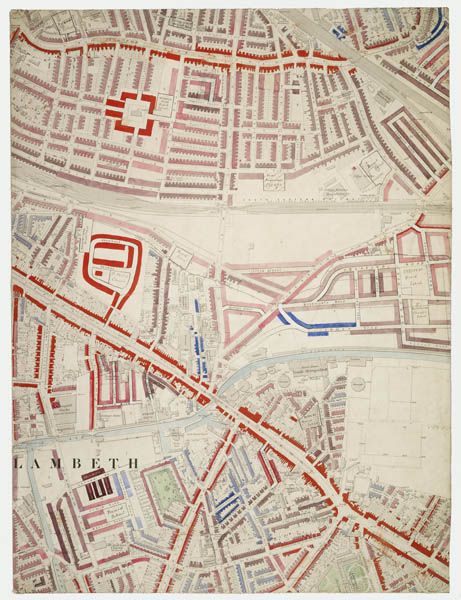
In 1891, this map was expanded to four sheets covering a wider area of London: from Kensington in the west to Poplar in the east, Kentish Town in the north to Stockwell in the south. These maps are known collectively as the Descriptive Map of London Poverty 1889. The original working maps from this edition are held in our collection.
In the late 1890s, Booth revisited the Inquiry to see if the social classes of streets had changed. Social investigators followed police officers across London and recorded their impressions of each street. Published between 1902 and 1903, these revised maps covered an even wider area of the city in 12 sheets. They showed that, in many cases, the income and class of residents had changed.
A stark illustration of wealth and poverty
The maps used colour coding to indicate the social character of every London street. This took into account factors such as regularity of income, work status and industrial occupation. In the 1891 edition, seven colours identified seven social classes, described in the map legend as:
- black: “Lowest class. Vicious, semi-criminal”
- dark blue: “Very poor, casual. Chronic want”
- light blue: “Poor. 18s. to 21s. a week for a moderate family”
- purple: “Mixed. Some comfortable others poor”
- pink: “Fairly comfortable. Good ordinary earnings”
- red: “Middle class. Well-to-do”
- yellow: “Upper-middle and upper classes. Wealthy”
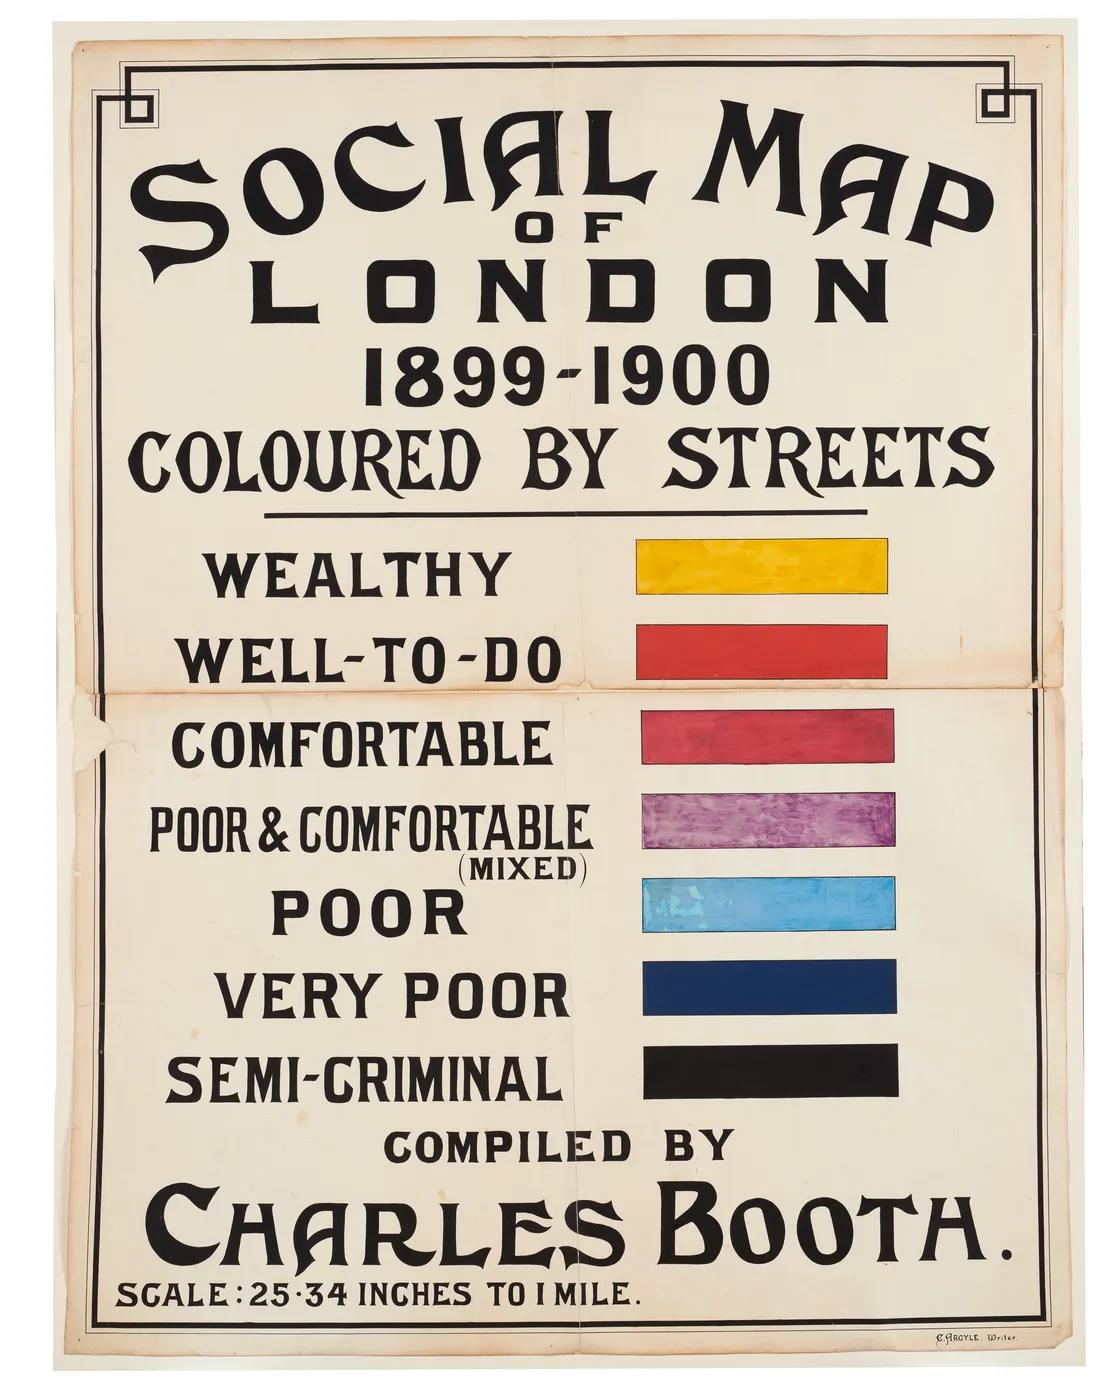
The key Booth used for colour coding social class.
“Class and wealth on London’s streets could shift in a short space of time”
Looking at the maps over 100 years later, you might see dramatic changes in the living conditions of the areas you’re familiar with. But Booth’s Inquiry also showed how, just like today, class and wealth on London’s streets could shift in a short space of time.
Take the example of The Old Nichol in Shoreditch. In the 1889 map, it was home to one of London’s worst slums. By the time Booth produced his revised map a decade later, the London County Council had begun transforming the area with new social housing.
Booth’s surveys showed that 30.7% of Londoners were living in poverty – more people than first thought. High levels of poverty is something the city continues to grapple with today.


